Time2Track

NeurIPS 2026 · Ziquan Wei, Tingting Dan, Guorong Wu

Time2Track

From Heartbeat to Cardiochoreography: A Mechanics Foundation Model for Individualized 4D Cardiac Motion Generation Conditioned on Electrophysiology

Abstract

The electrocardiogram (ECG) is a time series that records the electrical activity driving cardiac motion through electromechanical coupling (EMC), where the depolarization captured by ECG triggers each heartbeat. The temporal delay and low spatial resolution of such multichannel dynamic data often cause temporal and spatial misalignments along the physical motion, limiting the application of ECG data to event/segment-based downstream clinic practice. Although many efforts have been made to recover spatiotemporal trajectories conditioned on ECG waveforms, the intrinsic principle of EMC that results in various temporal delays remains underexplored in current generative models. To address this limitation, we propose Time2Track, a delay-aware generative model that generates individualized 4D heart motion from same-day ECG recordings by encoding electrophysiology as delay-aware token embeddings. Specifically, a learnable wavelet decomposition is employed to characterize the electromechanical delay, which is then formulated as a physics-based conditioning signal for motion diffusion. Time2Track generates 4D motion with individual-specific kinematics, avoiding the collapse to a population average, i.e., a common failure scenario when diffusing motions whose inter-subject differences are subtle. On n = 40,577 subjects from the UK Biobank, our Time2Track accurately synthesizes 4D cardiac trajectories from ECG and preserves inter-subject diversity, a regime in which generic motion diffusion baselines collapse to a population average.

Code (GitHub) Paper (PDF) UK Biobank · 40,577 ECG–mesh pairs

TL;DR

From a resting ECG, Time2Track keeps early and late hearts apart in time, while PhysCtrl collapses them into one average heartbeat.

0 ms

Loading the 4D meshes…

validation subjects, one line each, coloured by true end-systole
40,577paired resting ECG and cardiac MRI meshes, same visit
12 × 600ECG leads × samples at 500 Hz per input
388 × 50mesh control points × frames per cardiac cycle
8,093validation subjects behind every reported number
Hand motion from sEMG (emg2pose)

TL;DR

From sEMG, EMGFormer starts the joints of every hand at similar times, with or without Time2Track's delay tokens, so lockstep and staggered movements collapse into one.

0 ms

Loading the 4D hands…

test cycles, one line each, coloured by true joint onset spread
24,974sEMG recordings with motion-capture hand pose (emg2pose), each with a usable gesture cycle
16 × 7,790sEMG channels × samples at 2 kHz per input
20 × 7,280joint angles × samples predicted per window at 2 kHz
6,149held-out test sessions from 178 participants behind every reported number

Motivation

The ECG leads the heartbeat, by a delay that differs between people

The ECG records the electrical wave that triggers each contraction, and the mechanical response follows with a delay that differs between leads and between people.

In the UK Biobank, end-systole (ES, the frame of smallest heart volume) varies by 91 ms (SD) across 8,093 validation subjects, and the hearts with the earliest and latest ES differ in inter-lead ECG delay in 41 of 66 lead pairs, most strongly at V2 and V3.

PhysCtrl, a standard motion diffusion model with a generic ECG encoder, compresses this spread by a quarter and gives every subject a near-average heartbeat, which is the failure Time2Track targets.

lower: Cohen's d upper: p01

Lead pair

ECG of the selected lead pair

Loading…

Inter-lead delay separates early and late hearts. Cohen's d (lower) and p-value (upper, *** < 10−4, ** < 10−3, * < 10−2) compare the 12 × 12 inter-lead delays of the earliest (≤ 512 ms, n = 7,828) and latest (> 704 ms, n = 4,073) ES octiles, and hovering a cell shows its leads on the body and, for five random early and five random late validation subjects whose T-peak delays all lie within ±100 ms, the ECG of those two leads with each lead's T peak and the delay between them and, under each column, that early and late subject's heart motion on one template.
End-systole timing spread. PhysCtrl compresses the true 91 ms spread to 68 ms while Time2Track keeps 91 ms (ratio 0.997), a population property rather than per-subject accuracy.
The hand: sEMG timing and joint timing (emg2pose)

The same holds for the hand: staggered joints come with staggered sEMG

For surface EMG and hand pose (emg2pose), the 16 forearm channels switch on at different times, and they do so more when the joints of the movement start at different times, which is the timing a decoder must carry from the sEMG to the hand.

lower: Cohen's d upper: p01

Channel pair

sEMG of the selected channel pair

Loading…

sEMG onset lag separates staggered and lockstep movements. Cohen's d (lower) and p-value (upper, *** < 10−4, ** < 10−3, * < 10−2) compare the absolute activation-onset lag of every pair of the 16 sEMG channels between test gesture cycles whose joints start most in lockstep and most staggered, chosen within each of gestures (bottom and top octile of the gesture's joint onset spread after adjusting for cycle length, cycles of about 0.5 s), where the lag is larger in the staggered cycles for of 120 pairs (p < 0.05). Hovering a cell shows the two channels on the band (numbered as recorded, the band's rotation differs between sessions) and, for five random gestures, a lockstep and a staggered cycle of that gesture with both channels' envelopes, each channel's onset and the lag between them and, under each column, the two cycles' true hands.
Joint timing spread. Across the lockstep and staggered test cycles ( cycles, 2 kHz predictions, seed , whiskers 95 % bootstrap intervals), EMGFormer compresses the true ms SD of the joint onset spread to ms (ratio ) and with Time2Track keeps ms (ratio ), the same as with its delay tokens shuffled across channels ( ms), so neither keeps the true difference between lockstep and staggered movements (ratios over three seeds: ).

Contributions

What Time2Track adds

Delay tokenization on learned wavelets

Time2Track measures each lead's sub-sample lag against lead II at three learned wavelet scales with FFT cross-correlation and a soft-argmax, and gates the resulting delay tokens into the conditioning set.

ECG-conditioned 4D motion diffusion

To our knowledge, it is the first generator that conditions 4D cardiac mesh motion on multichannel ECG, through cross-attention in a spatio-temporal Transformer that starts from the subject's rest mesh.

A benchmark that measures collapse

On 40,577 ECG and mesh pairs, seven encoders share one diffusion backbone and are scored on diversity (APCR, APDR) and amplitude (PAR) as well as point-wise error, because predicting the mean can look accurate.

Method

Two token streams from one wavelet decomposition

A learnable wavelet front end, initialized from PhysioWave, feeds a morphology branch and a delay branch whose tokens condition a diffusion model that denoises 388 control points over 50 frames.
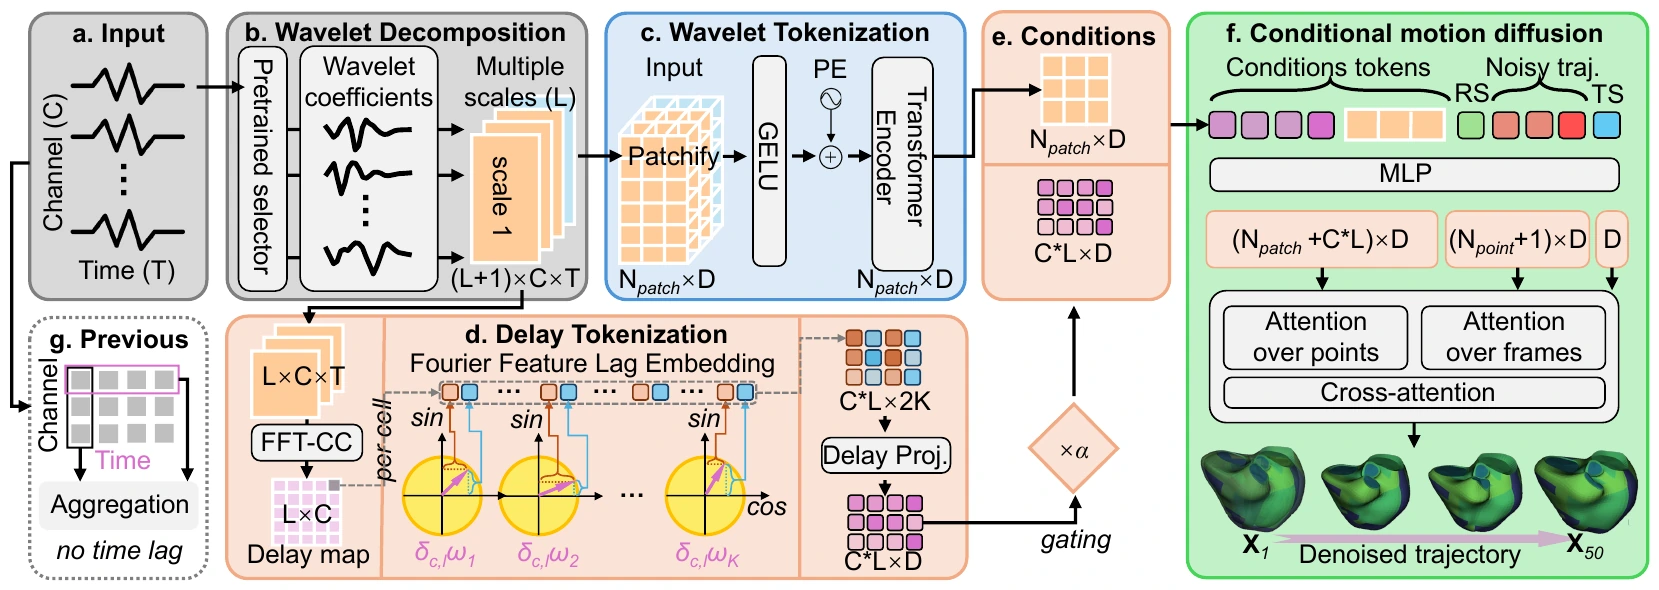
Time2Track framework from the paper: (a) multichannel input, (b) learnable wavelet decomposition, (c) wavelet tokenization, (d) delay tokenization with FFT cross-correlation and Fourier feature lag embedding, (e) conditions, (f) conditional motion diffusion over points and frames, and (g) previous encoders that aggregate channels without time lag.
Time2Track framework. A learnable wavelet decomposition of the multichannel signal feeds a morphology tokenization and a delay tokenization, and both token sets condition a spatio-temporal motion diffusion model, in contrast to previous encoders that aggregate the channels without time lag (Fig. 2 of the paper).

Measuring the lag

For lead c and wavelet scale ℓ, the lag is the soft-argmax of the normalized cross-correlation with lead II within ±τmax:

τ̂c(ℓ) = Σ|τ| ≤ τmax τ · softmaxτ ( βℓ Rc(ℓ)[τ] ),   R = 𝓕−1( 𝓕Wc ⊙ conj(𝓕Wr) ) / ‖Wc‖ ‖Wr‖

The delay δc(ℓ) = τ̂c(ℓ) − τ̂r(ℓ) is shift-invariant and differentiable, and the gate α starts at 0 so training begins from the morphology-only encoder.
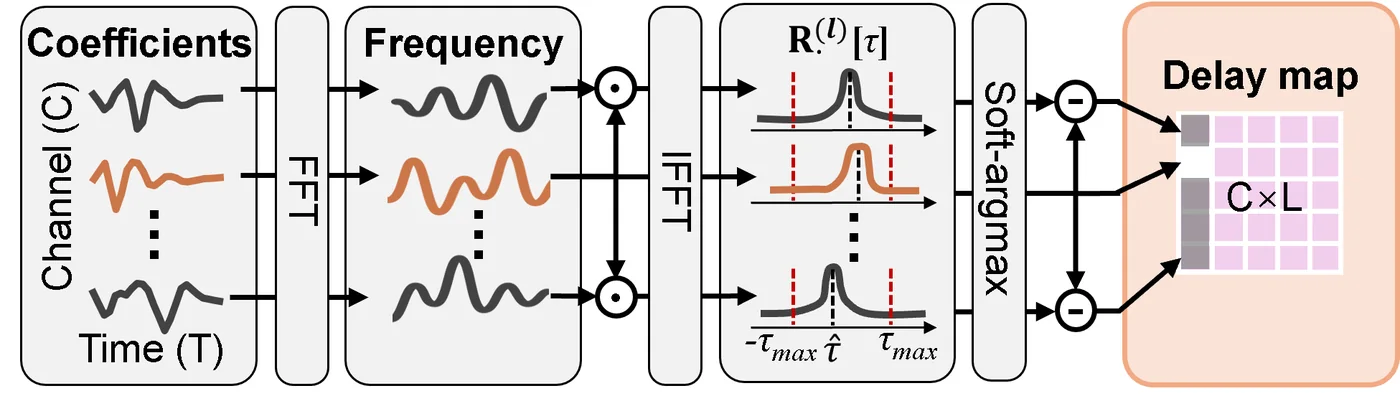
Diagram of FFT cross-correlation: wavelet coefficients of each lead are transformed, multiplied with the conjugate spectrum of the reference lead, and inverse transformed to give a delay per lead and scale.
FFT cross-correlation. Multiplying each lead's wavelet spectrum by the conjugate spectrum of the reference lead and inverting gives the cross-correlation from which the lag is read.

Metrics

Five metrics for amplitude and inter-subject diversity

PAR: are local peaks the right size?

A cubic in time is fitted to the trajectory of each point and removed. The cubic carries the slow systolic and diastolic sweep, so the residual keeps the faster local peaks. PAR divides the peak-to-peak range of the predicted residual by the true range, pooled over subjects and averaged over the 388 points and three axes. A value of 1 means local peaks of the true size, and a value below 1 means damped motion.

PAR = meanv Σi pp(Pred̂i,v) / Σi pp(GT̂i,v),  pp = max − min over frames

APD and APDR: do hearts differ by the right amount?

APD compares every pair of subjects by the RMS distance dij between their detrended whole-heart trajectories and divides the mean distance by the mean RMS amplitude of the same group. Owing to this division, APD measures spread relative to motion size. A model that shrinks every heart by one common factor keeps its APD, and APD falls only when the predicted hearts become alike. APDR is the predicted APD over the true APD, so a value below 1 marks a collapse toward one common motion.

APD = meani<j RMS(Xi − Xj) / meani RMS(Xi),  APDR = APDPred / APDGT
Ground truth
dij / mean RMS

dij / mean RMS
alike → different

APC and APCR: do hearts differ in timing?

For each subject, the Gram matrix G = XX⊤ of the detrended trajectory holds the inner product of the whole-heart displacement at every pair of frames, a 49 × 49 timing fingerprint. The RV coefficient scores the agreement of two fingerprints after normalising their size (1 for identical timing structure), and APC is its mean over all pairs. APCR is the predicted APC over the true APC, so a value above 1 means the predicted hearts share one timing pattern more than real hearts do.

RVij = ⟨Gi, Gj⟩ / ‖Gi‖ ‖Gj‖,  APC = meani<j RVij,  APCR = APCPred / APCGT
Ground truth
RVij

RVij
different → alike1

Results

Diversity is preserved, at a cost in point-wise error

Whole-heart vertex trajectories (Table 1)

RV and RMSE score the global trajectory, PAR the detrended amplitude, and APCR and APDR the inter-subject diversity (1 = true), with the ± of the diversity columns being the SD over 10,000 paired subject bootstrap resamples.
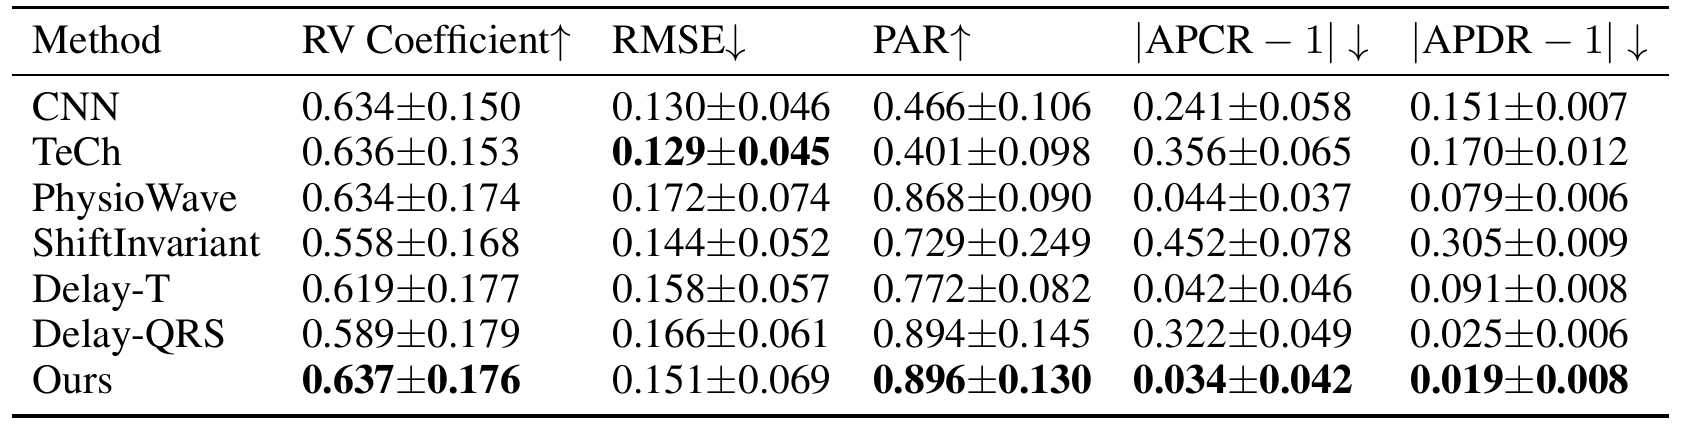
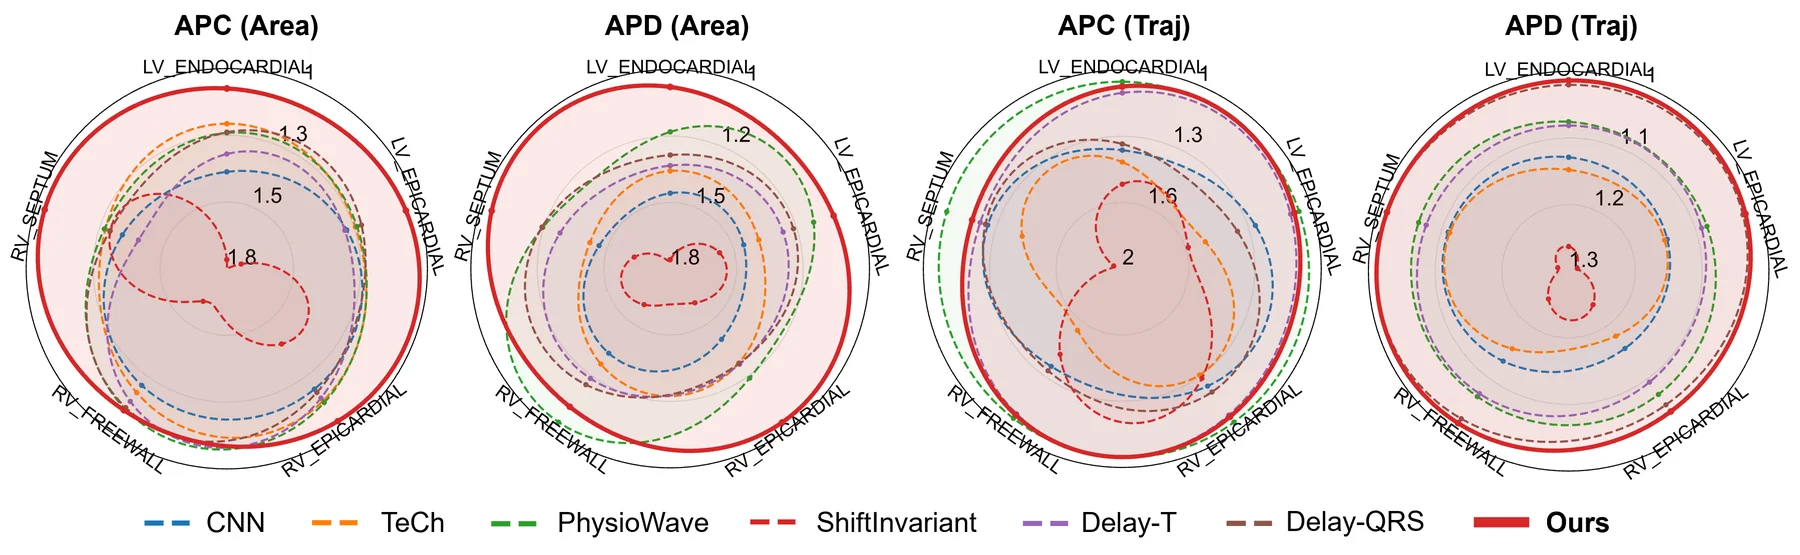
Table 1 of the paper: RV coefficient, RMSE, PAR, |APCR−1| and |APDR−1| for CNN, TeCh, PhysioWave, ShiftInvariant, Delay-T, Delay-QRS and Ours. Ours has the best RV 0.637, PAR 0.896, |APCR−1| 0.034 and |APDR−1| 0.019, and TeCh the best RMSE 0.129.
Four radar charts of APC and APD ratios on face area and vertex trajectory across five heart regions. Time2Track's solid red line lies on the outer ring of 1.0 in every region, while baselines draw inward.
Regional diversity. Across five heart regions Time2Track (solid red) stays on the ideal ratio of 1.0 while most encoders draw inward, under-estimating how much hearts differ.
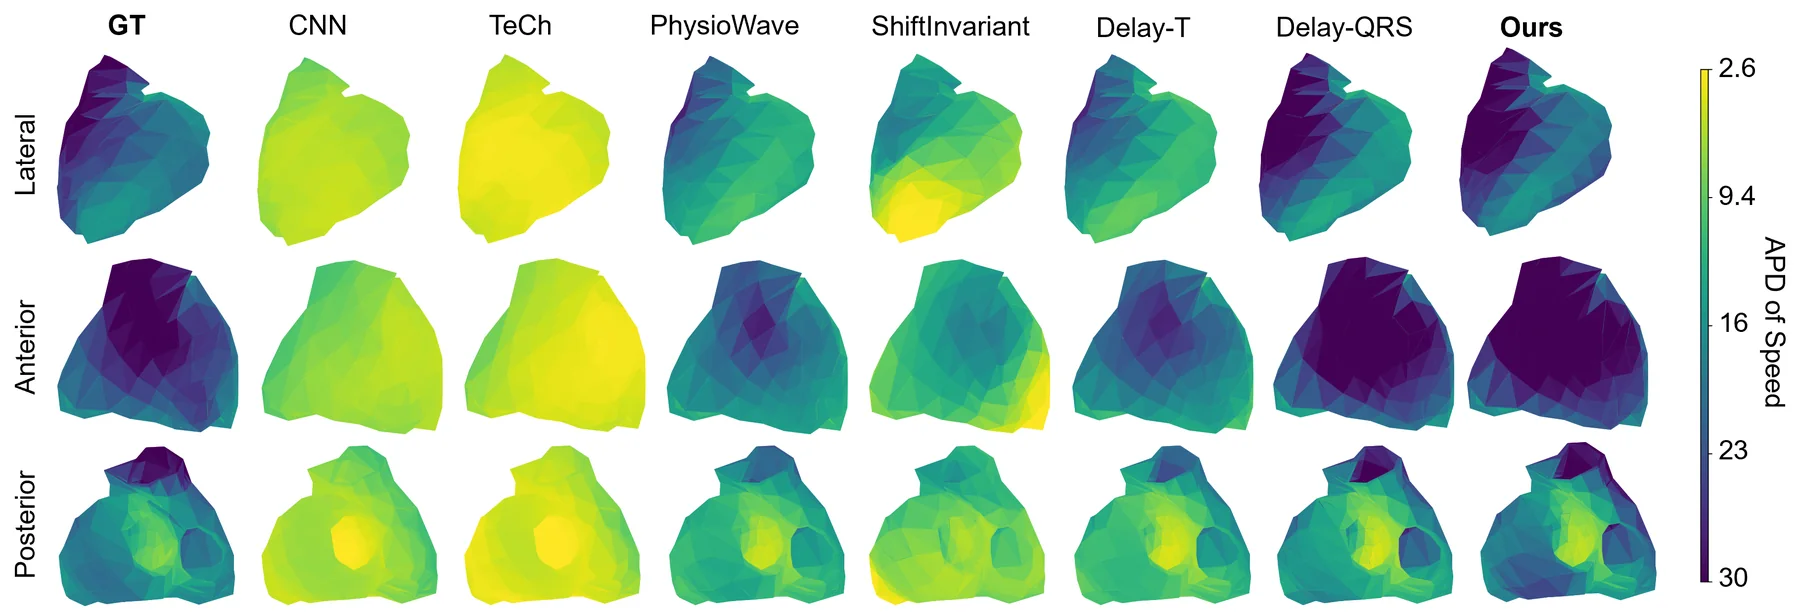
Heart meshes from lateral, anterior and posterior views colored by the average pairwise distance of vertex speed. Ground truth and Time2Track show dark, heterogeneous patterns, while CNN and TeCh are uniformly yellow.
Where hearts differ. Inter-subject distance of vertex speed is nearly uniform on the mesh for CNN, TeCh and ShiftInvariant, while Time2Track reproduces the heterogeneous ground-truth pattern most closely.
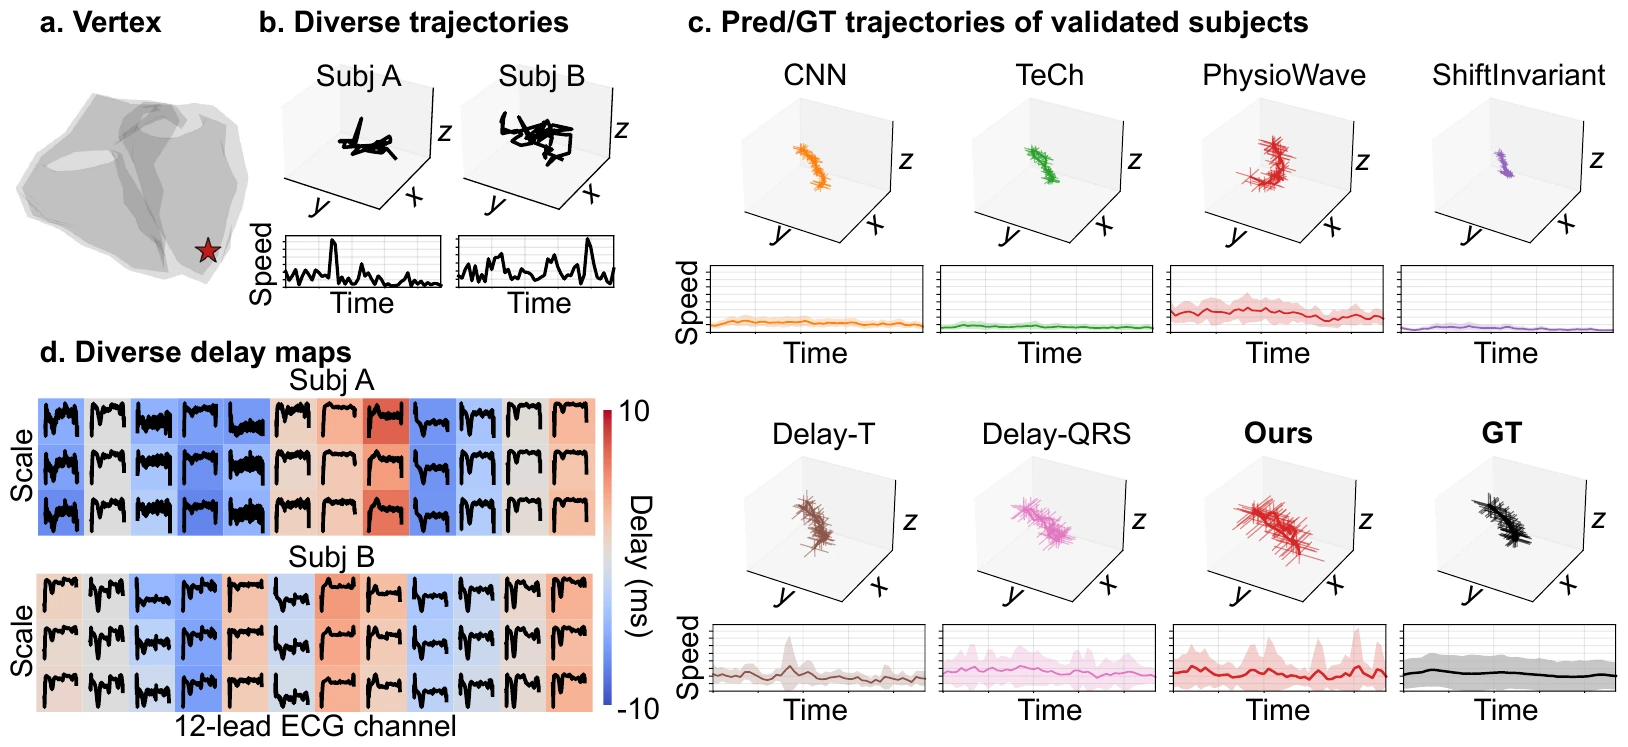
Qualitative comparison from the paper: a right-ventricular vertex, true 3D trajectories and speed profiles of two subjects, predicted trajectories and speed bands of CNN, TeCh, PhysioWave, ShiftInvariant, Delay-T, Delay-QRS, Ours and the ground truth, and multi-scale delay maps of the two subjects over the 12 ECG leads.
Trajectories and delay maps. At one right-ventricular vertex, true trajectories and speed profiles differ between subjects (b), the baselines collapse to a narrow bundle with flat speed while Time2Track recovers the spread of the truth (c), and the subject-specific multi-scale delay maps condition this spread (d) (Fig. 6 of the paper).

Analyses

Pathology, ECG-only use, emg2pose, and ablations

These analyses appear in the camera-ready paper (Section 4 and Appendix A.3, A.6 and A.7), with the tables typeset as in the paper.

Subjects with cardiac disease

Change from an equal number of randomly sampled healthy subjects to the 981 validation subjects with a cardiac ICD-10 code (Δ = diseased minus healthy, lower is better, best of each column in bold). Time2Track has the smallest RMSE change and the only decrease of |APCR−1|, which rises by 0.034 for CNN and by 0.064 for TeCh, while its |PAR−1| and |APDR−1| change by less than 0.01.

Table of the change from healthy to diseased subjects. Ours: RMSE +0.001, |PAR−1| +0.009, |APCR−1| −0.025, |APDR−1| +0.004. CNN: +0.005, −0.007, +0.034, −0.001. TeCh: +0.005, +0.008, +0.064, −0.005.

Downstream application with ECG as the only input

Without cardiac imaging at inference, Time2Track generates the 4D heart from the resting ECG alone by replacing the subject's rest mesh p0 with the population average, without retraining. Fidelity drops (RV −0.046, RMSE +0.031), while the diversity stays close to the truth (|APCR−1| 0.052, |APDR−1| 0.036).
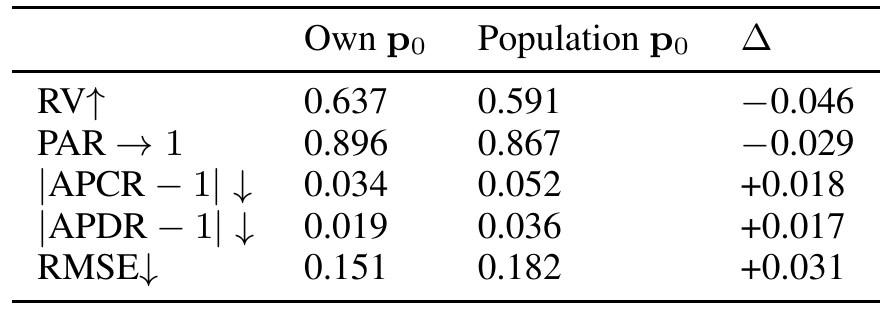
Table comparing Time2Track with its own rest mesh and with the population-average rest mesh: RV 0.637 and 0.591, PAR 0.896 and 0.867, |APCR−1| 0.034 and 0.052, |APDR−1| 0.019 and 0.036, RMSE 0.151 and 0.182.

Application to emg2pose

Adding delay tokens to two sEMG decoders of hand pose on the held-out test split of emg2pose lowers |PAR−1| of EMGFormer in every subset and |APCR−1| of both decoders in four of the five subsets, while RMSE and |APDR−1| change by less than 0.01 (three training seeds per model).
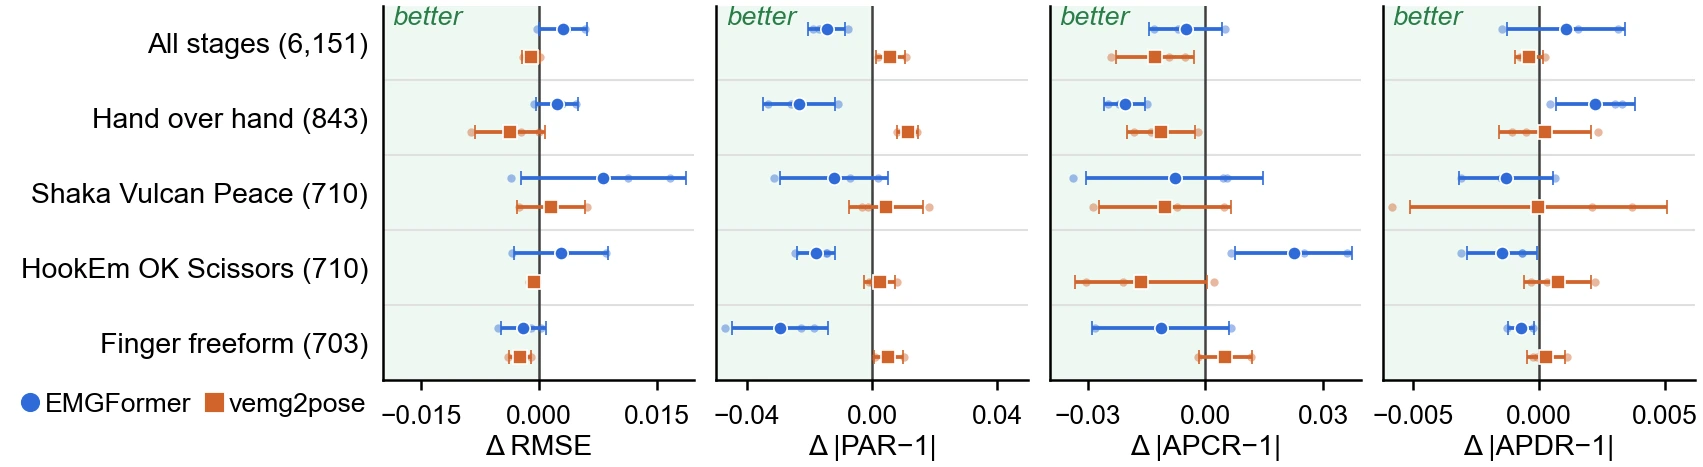
Four panels of the change in RMSE, |PAR−1|, |APCR−1| and |APDR−1|, model with delay tokens minus baseline, for EMGFormer and vemg2pose over all stages and four gesture stages, with seed dots and mean ± SD bars around zero.
Ablation studies

Ablation study #1: components of Time2Track

With the diffusion backbone and the schedule fixed, removing the delay branch lowers APDR from 0.981 to 0.826, replacing FFT-CC by fixed T or QRS delays or a raw scalar lag and replacing the Fourier-feature lag embedding move APCR and APDR away from 1, and patch lengths of 4, 8 or 16 collapse amplitude and diversity (PAR ≤ 0.726, APCR ≥ 2.275).
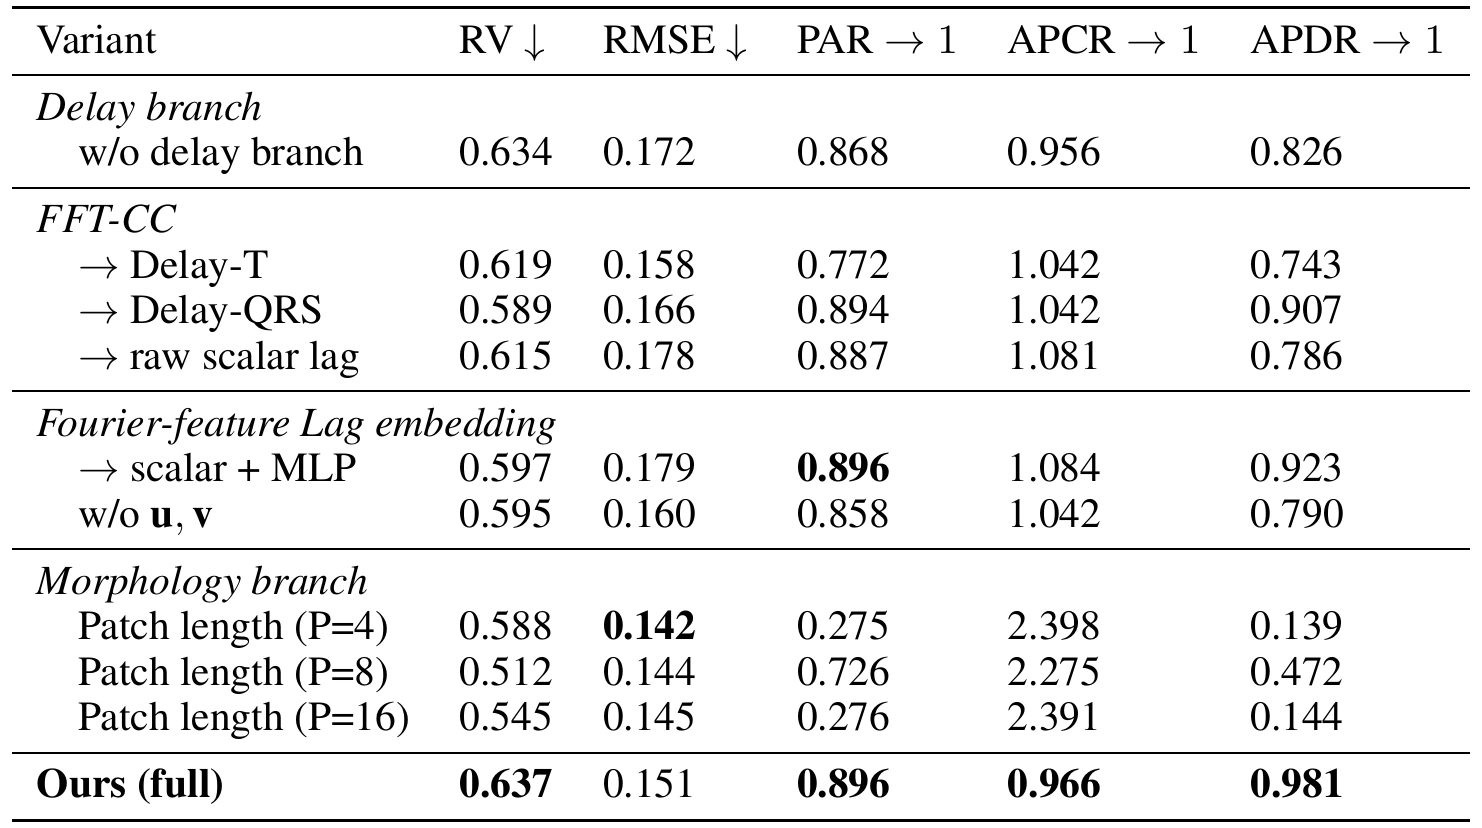
Component ablation table: without the delay branch APCR 0.956 and APDR 0.826; FFT-CC replaced by Delay-T, Delay-QRS or a raw scalar lag; the Fourier-feature lag embedding replaced by a scalar MLP or without positional embeddings; patch lengths 4, 8 and 16; the full model with PAR 0.896, APCR 0.966 and APDR 0.981.

Ablation study #2: electrode noise and missing leads

On the diseased subgroup, noise down to 5 dB SNR costs at most 3% fidelity with unchanged diversity, and dropping the reference lead II leaves fidelity intact but raises |APCR−1|.
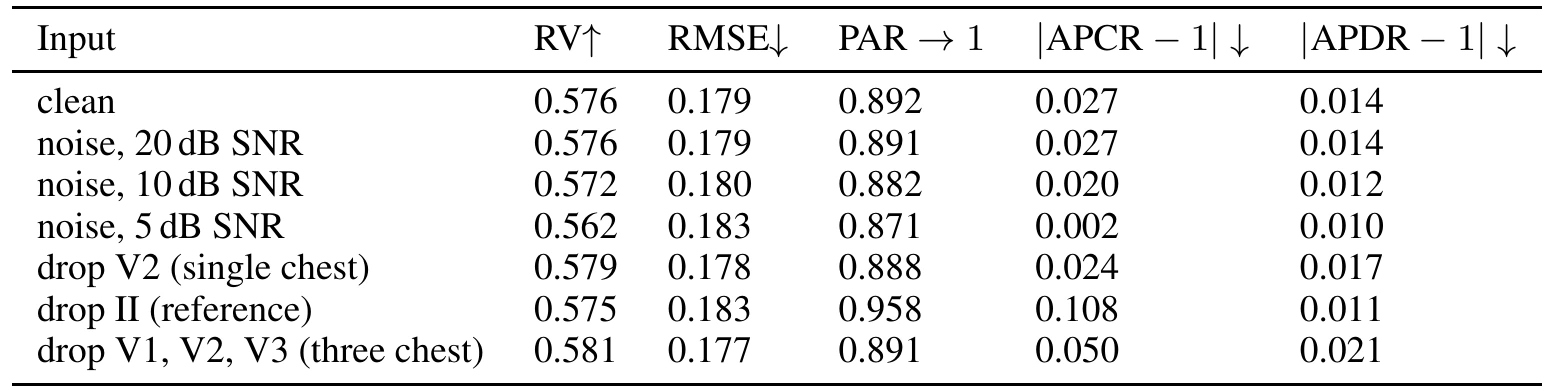
Table of RV, RMSE, PAR, |APCR−1| and |APDR−1| for clean input, noise at 20, 10 and 5 dB SNR, and dropped leads V2, II and V1 to V3. Dropping lead II raises |APCR−1| from 0.027 to 0.108.

Ablation study #3: lag window τmax

Changing τmax at inference across a 4× range moves no metric outside its bootstrap interval (95% intervals for RV and RMSE, default in bold).

Table of metrics for τmax of 25, 50, 75 and 100 frames (±50 to ±200 ms). RV stays between 0.565 and 0.570 and RMSE at 0.181 with overlapping intervals.

Ablation study #4: reference lead

Retraining Time2Track with aVR or aVL instead of lead II as the reference degrades the performance. The first row repeats Table 1.

Table of metrics for reference leads II, aVR and aVL. Lead II: RV 0.637, RMSE 0.151, PAR 0.896, |APCR−1| 0.034, |APDR−1| 0.019. aVR and aVL have lower RV and higher RMSE.